visxというairbnb発のreact用可視化ライブラリを触ったメモ
d3ベースで作られているためd3っぽい設定を知っておくとよい
themingや、animationの機能は自前のものを差し込むことができる
こういったライブラリのことをun-opinionedというらしい
primitiveな機能を備えているためchart作成だけでなく可視化用途としても使える
用語メモ
以下はドキュメント読んだ時のメモ
scale
d3のscaleに準じたwrapper。設定項目はd3のband参照
描画するデータの種類に依って指定するscaleを変える
数値のときはデータ範囲([min, max])、カテゴリ値のときはuniqueな値を渡す
axis
軸は別コンポーネントになっている。軸の表示範囲はscaleで設定する
shape
グラフの形式を指定する
BarGroupなんかは、1つの軸に複数要素の棒グラフが存在するようなグラフを作成するときに用いる
group
SVGにおける<g />タグのこと。子要素に対して適用された属性を継承する。SVGを使うとき、グループ化する要素を囲む
responsive
screen sizeに合わせてchartの大きさを変えたりしたい時に使う
↓のように親要素の大きさに応じて決めることができる
import ParentSize from "@visx/responsive/lib/components/ParentSize"
...
<ParentSize style={{ width: "600px", height: "400px" }}>
{parent => (
<Graph events={true} height={parent.height} width={parent.width} />
)}
</ParentSize>
...例
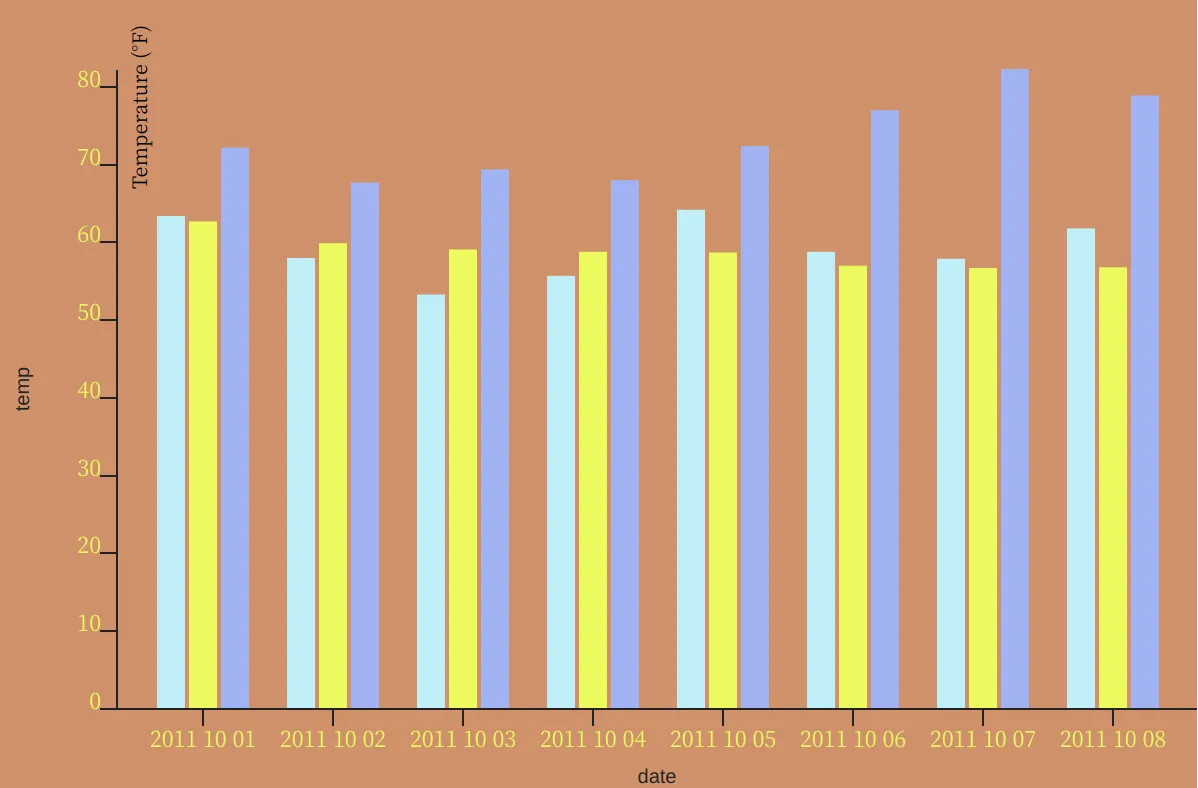
データ読み込んで棒グラフを出す。カスタムが細かくできるため必然的に長くなる
こんな図ができる
import React from "react"
import { Group } from "@visx/group"
import { BarGroup } from "@visx/shape"
import { AxisBottom, AxisLeft } from "@visx/axis"
import cityTemperature, {
CityTemperature,
} from "@visx/mock-data/lib/mocks/cityTemperature"
import ParentSize from "@visx/responsive/lib/components/ParentSize"
import { scaleBand, scaleLinear, scaleOrdinal } from "@visx/scale"
import { timeParse, timeFormat } from "d3-time-format"
const parseDate = timeParse("%Y-%m-%d")
//const format = timeFormat("%b %d")
const format = timeFormat("%Y %m %d")
const formatDate = (date: string) => format(parseDate(date) as Date)
const blue = "#aeeef8"
const green = "#e5fd3d"
const purple = "#9caff6"
const background = "#dd9165"
const PostLine = ({
height = 600,
width = 800,
events = false,
}: {
height: number
width: number
events: boolean
}) => {
const data = cityTemperature.slice(0, 8)
const keys = Object.keys(data[0]).filter(d => d !== "date")
const dateScale = scaleBand({
domain: data.map(d => d.date),
padding: 0.2,
})
const cityScale = scaleBand({
domain: keys,
padding: 0.1,
})
// 全数値データの中で、最大値に合わせる
const tempScale = scaleLinear({
domain: [
0,
Math.max(...data.map(d => Math.max(...keys.map(key => Number(d[key]))))),
],
})
const colorScale = scaleOrdinal({
domain: keys,
range: [blue, green, purple],
})
const defaultMargin = { top: 40, right: 0, bottom: 40, left: 60 }
const xMax = width - defaultMargin.left - defaultMargin.right
const yMax = height - defaultMargin.top - defaultMargin.bottom
dateScale.rangeRound([0, xMax])
cityScale.rangeRound([0, dateScale.bandwidth()])
tempScale.range([yMax, 0])
return width < 10 ? null : (
<svg width={width} height={height}>
<rect
x={0}
y={0}
width={width}
height={height}
fill={background}
/>
<Group top={defaultMargin.top} left={defaultMargin.left}>
<BarGroup
data={data}
keys={keys}
height={yMax}
x0={d => d.date}
x0Scale={dateScale}
x1Scale={cityScale}
yScale={tempScale}
color={colorScale}
>
{barGroups =>
barGroups.map(barGroup => (
<Group
key={`${barGroup.index}-${barGroup.x0}`}
left={barGroup.x0}
>
{barGroup.bars.map(bar => (
<rect
key={`${barGroup.index}-${bar.index}-${bar.value}-${bar.key}`}
x={bar.x}
y={bar.y}
width={bar.width}
height={bar.height}
fill={bar.color}
onClick={() => {
if (!events) return
const { key, value } = bar
alert(JSON.stringify({ key, value }))
}}
/>
))}
</Group>
))
}
</BarGroup>
</Group>
<AxisLeft
scale={tempScale}
left={defaultMargin.left}
top={defaultMargin.top}
label="temp"
tickLabelProps={() => ({
fill: green,
fontSize: 11,
textAnchor: "end",
})}
/>
<text x="-100" y="75" transform="rotate(-90)" fontSize={10}>
Temperature (°F)
</text>
<AxisBottom
left={defaultMargin.left}
top={yMax + defaultMargin.top}
tickFormat={formatDate}
scale={dateScale}
label="date"
tickLabelProps={() => ({
fill: green,
fontSize: 11,
textAnchor: "middle",
})}
/>
</svg>
)
}
const Index: React.FC<Props> = ({ data }) => {
return (
<ParentSize style={{ width: "600px", height: "400px" }}>
{parent => (
<PostLine events={true} height={parent.height} width={parent.width} />
)}
</ParentSize>
)
}
export default Index