React Google Chartsはその名の通り、google chartのreact component版
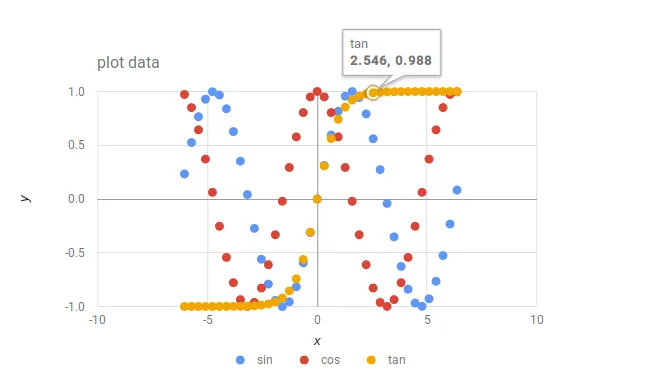
scatter plotを試してみたのでコードと結果を残しておく。D3よりも簡単に使えて、データの表示や選択などのアニメーションもいいかんじにやってくれる
環境
- node: v8.11.2
- react: 16.4.0
- react-google-charts: 2.0.16
コード
import React, { Component } from 'react'
import { Chart } from 'react-google-charts'
import './ScatterChart.css'
export default class ScatterChart extends Component {
constructor(props) {
super(props)
// get select event
this.chartEvents = [
{
eventName: 'select',
callback(Chart) {
console.log('Selected ', Chart)
},
},
]
this.state = {
options: {
title: 'plot data',
hAxis: { title: 'x', minValue: -1, maxValue: 1 },
vAxis: { title: 'y', minValue: -1, maxValue: 1 },
legend: { position: "bottom" },
width: 800,
height: 300,
explorer: {
actions: ['dragToZoom', 'rightClickToReset'],
axis: 'vertical',
keepInBounds: true,
maxZoomIn: 4.0,
animation: {
duration: 1000,
easing: 'out'
},
theme: 'material'
},
columns: [
{
type: 'number',
label: 'x',
},
{
type: 'number',
label: 'y',
}
],
}
}
render() {
return (
<Chart
chartType="ScatterChart"
data={this.props.dataArray}
columns={this.state.columns}
options={this.state.options}
graph_id="Chart"
chartEvents={this.chartEvents}
className="Poly-chart"
legendToggle
/>
)
}
}import React, { Component } from 'react'
import ScatterChart from './ScatterChart'
export default class App extends Component {
constructor(props) {
super(props)
this.state = {
dataArray: this.getDataArray()
}
}
getDataArray() {
let len = 20
let dataArray = [['x', 'sin', 'cos', 'tan']]
for (let i = -len; i < len; i++) {
let x = (i + 1) / Math.PI
dataArray.push([x, Math.sin(x), Math.cos(x), Math.tanh(x)])
}
return dataArray
}
render() {
return(
<div>
<ScatterChart dataArray={this.state.dataArray} />
</div>
)
}
}表示すると以下のようになる