networkxで2部グラフ解析 - スペクトラルクラスタリング -
networkxを使って、2部グラフのネットワーク解析
skleanのspectral-clusteringを用いてクラスターを作成、可視化してみる
環境
- python: 3.6.8
- networkx: 2.4
スペクトラルクラスタリング
グラフの隣接行列から、繋がりの強い部分をまとめるような手法
言葉だけで書いておくと、 グラフラプラシアンの固有値が大きいもの数個クラスタリングしてそれらに近いものを各々のクラスとしてまとめている
使用するデータは例によってDavis Southern Club Women
クラスタ数は2とした
import networkx as nx
from networkx.algorithms import bipartite
import numpy as np
from sklearn.cluster import SpectralClustering
from sklearn import metrics
np.random.seed(1)
import matplotlib.pyplot as plt
%matplotlib inline
# load data
G = nx.davis_southern_women_graph()
women = G.graph['top']
clubs = G.graph['bottom']
W = bipartite.weighted_projected_graph(G, women)
# as np matrix
adj_mat = nx.to_numpy_matrix(W)
# Cluster
sc = SpectralClustering(2, affinity='precomputed', n_init=100, assign_labels='discretize')
sc.fit(adj_mat)
print('spectral clustering')
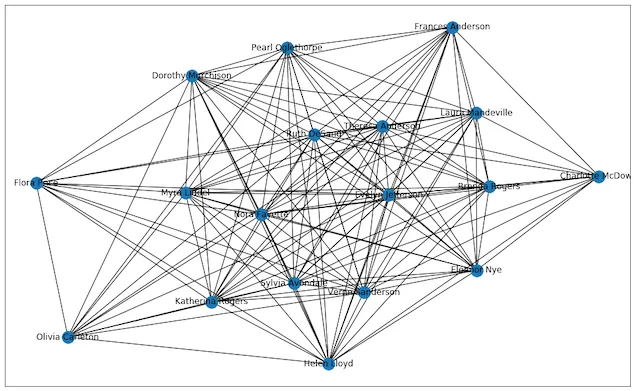
print(sc.labels_)- 元のネットワーク

plt.figure(figsize=(16, 10))
nx.draw_networkx(W)- クラスごとに色分けしたもの

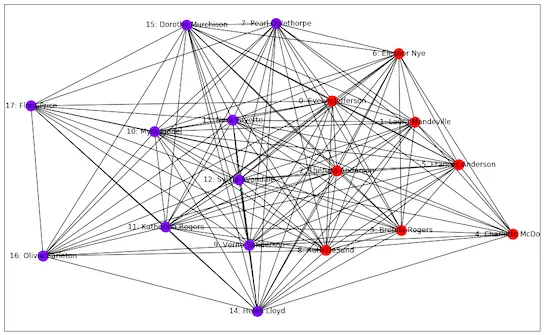
plt.figure(figsize=(16, 10))
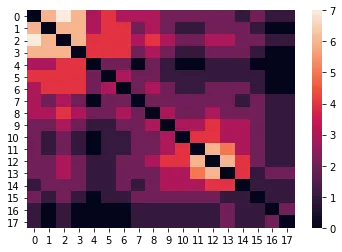
nx.draw_networkx(W, node_color=sc.labels_, cmap=plt.cm.rainbow, labels={d[0]: f'{i}: {d[0]}' for i, d in enumerate(W.nodes(data=True))})きれいに別れてそうな雰囲気。数字は以下の隣接行列のindexに合わせて番号を付けている
実際、隣接行列をみると0,1,2,3と11,12,13,14あたりが強いつながりを作ってることがわかる

実装はgistにしてある
gist:uni-3/9e998977bfa26abb0c3ebb8693f9d180
参考
-
関係データ学習 (機械学習プロフェッショナルシリーズ)
-
https://stackoverflow.com/questions/46258657/spectral-clustering-a-graph-in-python