bq-monitoring は bigquery で実行されるクエリパフォーマンスや課金額について確認できる便利テーブルを作成する dbt package
自前でかいてもいい気もするが、便利(特に query_with_better_pricing_using_on_demand_view とか)モデルが目白押しなので導入してみる
データソースとして information schema、加えて audit log、billing export も利用できる
環境
- dbt: 1.11.7
- dbt-bigquery: 1.11.0
前提として、bigquery 向けの dbt project は設定済みとする
設定
- install
公式ドキュメントより、以下を pacakges.yml に追加
# packages.yml
packages:
  - package: bqbooster/dbt_bigquery_monitoring
    version: [">=0.24.0", "<1.0.0"]
パッケージをインストール
dbt deps
dbt_project.yml 設定
最終的な dbt_project.yml は以下のようになった。色々変数の設定などオプションが充実している
課金体系を ondemand モデル(スロット課金ではない)、bi engine なども使っていないので無効にしている
use_copy_partitions の項目については後述
models:
...
dbt_bigquery_monitoring:
+enabled: "{{ target.type == 'bigquery' }}"
+schema: dbt_bigquery_monitoring
# disable models that bi engine and reservation
monitoring:
compute:
datamart:
bi_engine:
+enabled: false
intermediate:
reservation:
+enabled: false
information_schema:
reservations:
+enabled: false
bi_engine:
+enabled: false
...
vars:
# bigquery monitoring
use_copy_partitions: false
output_partition_expiration_days: 90 # default 365
...モデル生成
一連のモデルに関するテーブルの作成は以下コマンドを実行
dbt run --select dbt_bigquery_monitoring
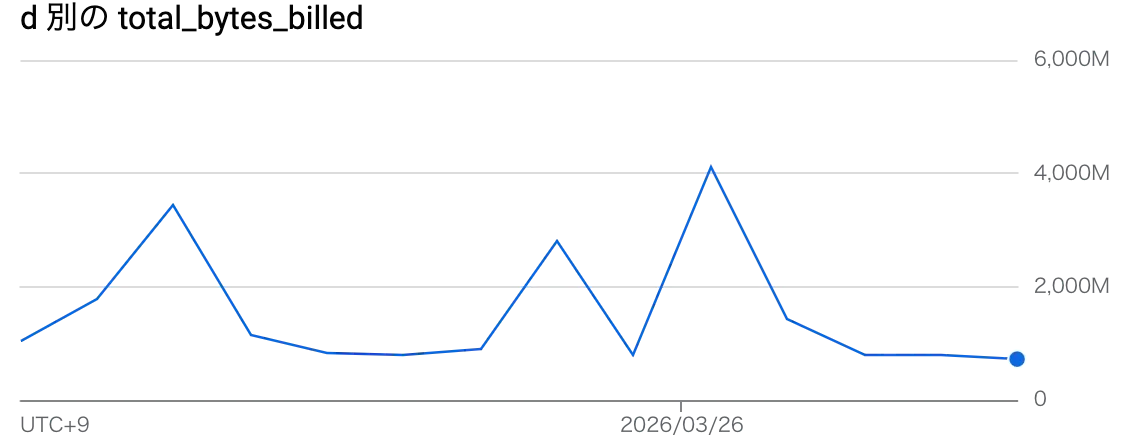
以下のクエリで簡単に日別のコスト推移を取得できたり、更に細かい粒度(ユーザーごとなど)の集計値も作られる
SELECT date(day) as d, total_query_cost, total_slot_ms, query_count, unique_users, total_bytes_billed FROM `project_id.dbt_bigquery_monitoring.cost_per_project` LIMIT 1

...
d	total_query_cost	total_slot_ms	query_count	unique_users	total_bytes_billed
2026-03-24	0.0	1782444	505	37	2818572288
せっかくなので日別の total_bytes_billed 推移のプロット載せておく
チューニング
実行時間かかるモデルがいたので調査したメモ
compute_cost_per_minute
他モデルの生成クエリは数秒で終わるが、compute_cost_per_minute は(compute_cost_per_hour も同じく)数十秒かかった
原因は copy_partitions の挙動。該当モデルの上流にある compute_rollup_per_minute モデルにて、incremetal 実行時に既存テーブルの partition を一時テーブルにコピーしている。こちらの処理で時間がかかっている模様。デフォルトで有効になっている。copy job は bigquery のジョブ履歴に残らないので見つけづらい部分だった
model ファイルと関連 macros をみてみると copy_partitions の設定値に変数を使っており、デフォルトでは true になっている
該当モデル
compute_rollup_per_minute.sql
{{
config(
...
partition_by={
"field": "minute",
"granularity": "hour",
"data_type": "timestamp",
"copy_partitions": dbt_bigquery_monitoring_variable_use_copy_partitions()
},
cluster_by = ['minute', 'project_id'],
partition_expiration_days = dbt_bigquery_monitoring_variable_output_partition_expiration_days()
)
}}
SELECT
...macros
...
{% macro dbt_bigquery_monitoring_variable_use_copy_partitions() %}
{{ return(force_bool(dbt_bigquery_monitoring_variable_priority('use_copy_partitions', 'DBT_BQ_MONITORING_USE_COPY_PARTITIONS', true))) }}
{% endmacro %}
...
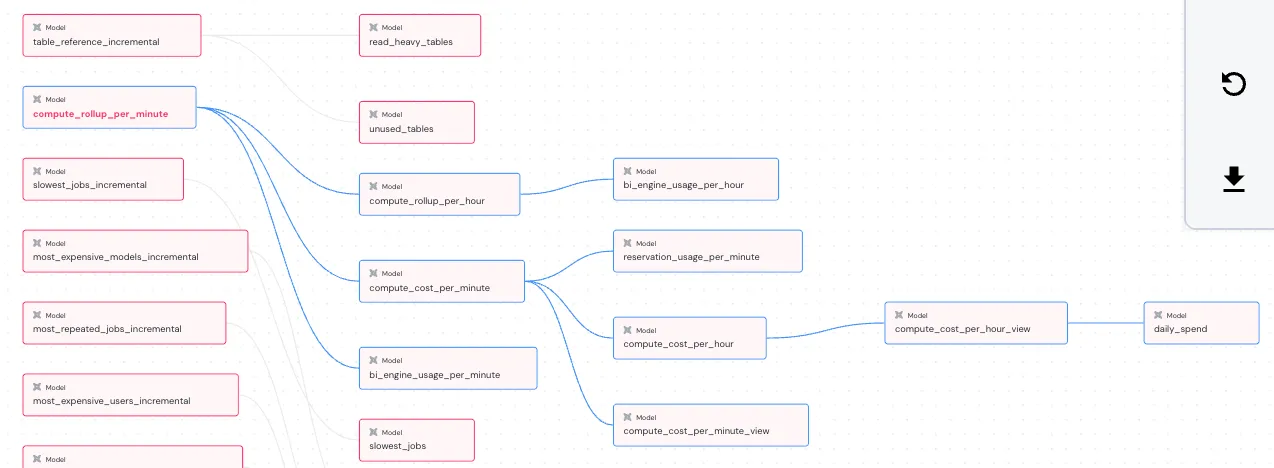
また、compute_rollup_per_minute はモデルのリネージ daily spent といった日別コストのモデルのもととなるテーブルになっている。リネージは elementary dashboard より
実行比較
以下に条件を変えて一度試した実行時間をまとめる。割と実行時間に差がでた。2 番目のケース一番早いが、マテリアライズを変えることによる影響が不確かなので、use_copy_partitions false に設定しておくことにした
| ケース(設定・操作) | 実行時間 | 結果 |
|---|---|---|
標準(use_copy_partitions: true)実行 | 27.47s | 0 processed |
テーブルとして作成 +materialized: table 適用 | 5.91s | 126.0 rows / 831.8 KiB |
copy しない use_copy_partitions: false 適用 | 12.05s | SCRIPT (2.6 KiB) |
軽く検索しても ISSUE とか対策記事は見つからなかった。variable をみて対策できているのだろう、もしくは、問題となるほど時間かかっていないのかしら
copy job の確認
一応 copy job 単位でも見てみる。コンソール画面のジョブ履歴からは確認できなかったため INFORMATION_SCHEMA から取得した
結果をすべて貼ると長いため必要な部分を抜粋する
millisec,destination_table. table_id
904,compute_cost_per_minute$2026032500compute_rollup_per_minute の partition 単位(hour)で copy job が実行されており、一度に 1 秒くらいかかっている事がわかる
これらの copy job は partition ごとに実行するため、結果として数十秒かかるのも頷ける
- copy job 確認クエリ
SELECT
job_id,
start_time,
end_time,
date_diff(end_time, start_time, second) as sec,
destination_table,
FROM
`region-us`.INFORMATION_SCHEMA.JOBS_BY_PROJECT
WHERE
job_type = 'COPY'
-- 適当な期間
AND creation_time > TIMESTAMP_SUB(CURRENT_TIMESTAMP(), INTERVAL 10 DAY)
ORDER BY
creation_time DESCcopy_partitions について調べた感じ、dbt 公式ブログの言う通り、データ量が少ない、大量にパーティションがある場合はオーバーヘッドの関係で遅くなるらしい
Though it looks like a silver bullet, there are cases where we DON’T want to use it:
- If we have a small partition, merging on a small table, the gains are negligible
- If a lot of partitions are involved, the copy will happen sequentially. It could be parallelized in another update but depending on how many concurrent operations would be configured, the performance might still not improve enough over a
MERGEstatement.
ちなみに、今回は 1 時間数件もクエリ実行しないプロジェクトなので、余計差が際立ったかもしれない