observable frameworkにて、ネットワーク分析でおなじみkarate clubデータを可視化した。observable frameworkを初めて触ったのでプロジェクトのセットアップからデプロイまでの方法も書いておく
グラフDB的なデータの扱いをやってみたかったので、duckdbとduckpgqを使ってデータを取り込み、d3にて可視化した。duckpgqは元のリレーショナルテーブルに対してグラフ探索の表現力と処理を可能にするCommunity Extensionsで公開されている拡張機能のこと
observable frameworkとは
主な特徴
-
静的ビルド: SSGサイトとして生成される。個別のレポートページが独立しており高速に読みこまれる
-
データローダー (Data Loaders): データ取得、加工処理をビルド時に行い、ブラウザ(クライアント)側は生成された(軽量化された)データ(JSON, CSV, Parquetなど)を読みこむ。
データローダーにはR、python、shellなどを用いることができ、好みの言語でデータロード、加工ができる
- ページ: コンテンツはmdファイルで記述可能なため。レポーティングも得意。tocの追加などfrontmatter にて設定できる機能も充実している
- 無料かつオープン: OSSなので、ビルド環境を用意すれば自分のサーバーやGitHub Pages等に静的ページとしてデプロイ可能
Observable社が提供するプラットフォームなどは探した範囲では見つからなかった。observable notebookを作成、公開するobservable cloud?がでてきた
実装
デフォルトのコンポーネントにグラフネットワーク描画用のものはなかったので、d3.jsを使ってplotを定義した
また、データについてはduckdb with pythonによるデータローダー経由で描画用のデータセットを書き出す処理をしている
プロジェクト生成
プロジェクトの初期設定から
node.jsインストール済の状態で実行する。対話型で適当に埋めていくと、直下にプロジェクトが作成される
npx @observablehq/framework@latest create
...
◆ Welcome to Observable Framework! 👋 This command will help you create a new app.
│ When prompted, you can press Enter to accept the default value.
│
│ Want help? https://observablehq.com/framework/getting-started
│
◇ Where should we create your project?
│ ./framework-dashboard
│
◇ What should we title your app?
│ Framework Dashboard
│
◇ Include sample files to help you get started?
│ Yes, include sample files
│
◇ Install dependencies?
│ Yes, via npm
│
◇ Initialize git repository?
│ Yes
│
◓ Installing dependencies via npm...グラフコンポーネント
markdown内にも直接グラフ描画するスクリプトはかけるが、ここではcomponentsとして定義
d3苦手なのでAIに書いてもらった。src/components/network.js として作成。Force Directed DiagramとCircular Layoutなネットワーク図を描く、2種類の関数を定義
import * as d3 from "d3";
function nodeDegrees(nodes, links) {
const nodeMap = new Map(nodes.map(d => [d.id, d]));
nodes.forEach(n => n.degree = 0);
links.forEach(l => {
if (nodeMap.has(l.source)) nodeMap.get(l.source).degree++;
if (nodeMap.has(l.target)) nodeMap.get(l.target).degree++;
});
}
export function createNetworkGraph(data, {width = 600, height = 600} = {}) {
// コピー
const links = data.links.map(d => ({...d}));
const nodes = data.nodes.map(d => ({...d}));
// 次数 (degree) を付与
nodeDegrees(nodes, links);
// カラーパレット
const color = d3.scaleOrdinal(d3.schemeTableau10);
// シミュレーションの設定
const simulation = d3.forceSimulation(nodes)
.force("link", d3.forceLink(links).id(d => d.id).distance(100)) // リンクの長さ
.force("charge", d3.forceManyBody().strength(-400)) // 反発力
.force("center", d3.forceCenter(width / 2, height / 2)); // 重心
// SVGコンテナの作成
const svg = d3.create("svg")
.attr("width", width)
.attr("height", height)
.attr("viewBox", [0, 0, width, height])
.attr("style", "max-width: 100%; height: auto;");
// リンク(線)の描画
const link = svg.append("g")
.attr("stroke", "#999")
.attr("stroke-opacity", 0.6)
.selectAll("line")
.data(links)
.join("line")
.attr("stroke-width", d => Math.sqrt(d.value) * 2);
const node = svg.append("g")
.attr("stroke", "#fff")
.attr("stroke-width", 1.5)
.selectAll("circle")
.data(nodes)
.join("circle")
.attr("r", d => d.degree) // 半径を次数に比例させる(ベース小さく)
.attr("fill", d => color(d.group))
.call(drag(simulation)); // ドラッグ操作を有効化
// tooltip not working
node.append("title")
.text(d => `ID: ${d.id}\nConnections: ${d.degree}`);
const text = svg.append("g")
.selectAll("text")
.data(nodes)
.join("text")
.text(d => d.id)
.attr("font-size", 10)
.attr("dx", 12)
.attr("dy", 4)
.attr("fill", "currentColor");
text.append("title")
.text(d => `ID: ${d.id}\nConnections: ${d.degree}`);
// タイマーごとに位置を更新
simulation.on("tick", () => {
link
.attr("x1", d => d.source.x)
.attr("y1", d => d.source.y)
.attr("x2", d => d.target.x)
.attr("y2", d => d.target.y);
node
.attr("cx", d => d.x)
.attr("cy", d => d.y);
text
.attr("x", d => d.x)
.attr("y", d => d.y);
});
// ドラッグ操作の実装
function drag(simulation) {
function dragstarted(event) {
if (!event.active) simulation.alphaTarget(0.3).restart();
event.subject.fx = event.subject.x;
event.subject.fy = event.subject.y;
}
function dragged(event) {
event.subject.fx = event.x;
event.subject.fy = event.y;
}
function dragended(event) {
if (!event.active) simulation.alphaTarget(0);
event.subject.fx = null;
event.subject.fy = null;
}
return d3.drag()
.on("start", dragstarted)
.on("drag", dragged)
.on("end", dragended);
}
return svg.node();
}
// 円形配置 (Circular Layout)
export function createCircularGraph(data, {width = 600, height = 600} = {}) {
// コピー
const nodesRaw = data.nodes.map(d => ({...d}));
nodeDegrees(nodesRaw, data.links);
const radius = Math.min(width, height) / 2 * 0.8;
const nodes = nodesRaw.map((d, i) => {
const angle = (i / nodesRaw.length) * 2 * Math.PI;
return {
...d,
x: (width / 2) + radius * Math.cos(angle - Math.PI / 2),
y: (height / 2) + radius * Math.sin(angle - Math.PI / 2)
};
});
const nodeById = new Map(nodes.map(d => [d.id, d]));
const links = data.links.map(d => ({
...d,
source: nodeById.get(d.source),
target: nodeById.get(d.target)
}));
const color = d3.scaleOrdinal(d3.schemeTableau10);
const svg = d3.create("svg")
.attr("width", width)
.attr("height", height)
.attr("viewBox", [0, 0, width, height])
.attr("style", "max-width: 100%; height: auto; font: 10px sans-serif;");
// リンク
svg.append("g")
.attr("fill", "none")
.attr("stroke-opacity", 0.4)
.selectAll("path")
.data(links)
.join("path")
.style("mix-blend-mode", "multiply")
.attr("d", d => {
return `M${d.source.x},${d.source.y} L${d.target.x},${d.target.y}`;
})
.attr("stroke", d => color(d.source.group))
.attr("stroke-width", 1);
// ノード
const node = svg.append("g")
.attr("stroke", "#fff")
.attr("stroke-width", 1.5)
.selectAll("circle")
.data(nodes)
.join("circle")
.attr("cx", d => d.x)
.attr("cy", d => d.y)
.attr("r", d => d.degree) // 半径を次数に比例させる(強調)
.attr("fill", d => color(d.group))
// ツールチップ
node.append("title")
.text(d => `ID: ${d.id}\nConnections: ${d.degree}`);
// ラベル
svg.append("g")
.selectAll("text")
.data(nodes)
.join("text")
.attr("x", d => d.x)
.attr("y", d => d.y)
.attr("dy", "0.31em")
.attr("dx", d => d.x < width / 2 ? -10 : 10)
.attr("text-anchor", d => d.x < width / 2 ? "end" : "start")
.text(d => d.id)
.clone(true).lower()
.attr("fill", "none")
.attr("stroke", "white")
.attr("stroke-width", 3);
// ラベルにもツールチップを追加
svg.select("g:last-child").selectAll("text")
.append("title")
.text(d => `ID: ${d.id}\nConnections: ${d.degree}`);
return svg.node();
}pythonデータローダー
python経由でduckdbを使ってデータの加工、d3のネットワークグラフで読める形式に変換する
loaderとデータのインターフェースは標準出力なため、保存したい値をprintしたもの(ここではoutput変数)がjsonファイルとして src/data 以下に保存される
outputのjson値加工までduckdbで行ければよかったが、duckdbの処理エンジンに関するエラーが出てしまい、断念した。
ほぼduckpgqを使いたいだけになってしまった。networkx使ったほうが無理なくできそう
src/data/karate-network.json.py に作成
#!/usr/bin/env -S uv run
# /// script
# requires-python = ">=3.12"
# dependencies = [
# "duckdb==1.2.1",
# ]
# ///
import duckdb
import sys
import json
def main():
try:
# unsigned extension for install duckpgq
con = duckdb.connect(config={'allow_unsigned_extensions': 'true'})
# DuckPGQとhttpfsのインストールとロード
con.sql("INSTALL duckpgq FROM community;")
con.sql("INSTALL httpfs;")
con.sql("LOAD duckpgq;")
con.sql("LOAD httpfs;")
# Karate Club データのロード (Edges) headerないので適当なカラム名をつけている
con.sql("CREATE TABLE Edges AS SELECT column0 AS source_id, column1 AS target_id FROM read_csv_auto('https://raw.githubusercontent.com/raphaelgodro/Kernighan-Lin/master/karate-network.csv');")
# Nodes テーブルの生成 (EdgesからユニークなIDを抽出)
con.sql("CREATE TABLE Nodes AS SELECT DISTINCT source_id AS id, cast(id as VARCHAR) as name FROM Edges UNION SELECT DISTINCT target_id AS id, cast(id as VARCHAR) as name FROM Edges;")
# プロパティグラフの定義
con.sql("""
CREATE PROPERTY GRAPH karate_club
VERTEX TABLES (
Nodes
)
EDGE TABLES (
Edges
SOURCE KEY (source_id) REFERENCES Nodes (id)
DESTINATION KEY (target_id) REFERENCES Nodes (id)
LABEL connects
);
""")
# 全エッジを取得
query = """
SELECT
source,
target
FROM GRAPH_TABLE (
karate_club
MATCH (a:Nodes)-[e:connects]->(b:Nodes)
COLUMNS (a.name AS source, b.name AS target)
)
"""
# 結果を取得
rows = con.sql(query).fetchall()
# d3用の nodes, links を構築
nodes_set = set()
links = []
for source, target in rows:
if source and target: # NULLチェック
nodes_set.add(source)
nodes_set.add(target)
links.append({"source": source, "target": target, "value": 1})
nodes = [{"id": name, "group": 1} for name in nodes_set]
output = {"nodes": nodes, "links": links}
# 出力
print(json.dumps(output))
except Exception as e:
sys.stderr.write(f"Error: {str(e)}\n")
sys.exit(1)
if __name__ == "__main__":
main()
ファイルのトップにshebang的なのを書いているが、こちらはuv scripts用の設定。こちらを使うとファイル別に必要なパッケージの設定ができて便利。これによりpyproject.ymlやuv.lockファイルをリポジトリで管理をする必要がなくなる
https://docs.astral.sh/uv/guides/scripts/
実行するとinstall packageしてから処理がはじまる
uv run src/data/karate-network.json.py
Installed 1 package in 8ms
{"nodes": [{"id": "1", "group": 1}, {"id": "11", "group": 1}, {"id": "22", "group": 1}, {"id": "17", "group": 1}, {"id": "31", "group": 1}, {"id": "21", "group": 1}, {"id": "34", "group": 1}, {"id"
....ちなみにデータの中身はこんな感じ。nodeのエッジ情報が入っている
curl https://raw.githubusercontent.com/raphaelgodro/Kernighan-Lin/master/karate-network.csv
1,2
1,3
1,4
1,5
...page(markdown)
src/karate-network.md として作成。参照データ(data/karate-network.json)はビルド時に生成される
---
theme: dashboard
title: network graph
toc: true
---
## カラテクラブネットワーク図️
```js
// データローダーが生成したJSONを読み込む
const data = FileAttachment("data/karate-network.json").json();
```
```js
import {createNetworkGraph, createCircularGraph} from "./components/network.js";
```
<div class="grid grid-cols-2">
<div class="card">
<h3>Force Layout</h3>
${createNetworkGraph(data, {width: width, height: 500})}
</div>
<div class="card">
<h3>Circular Layout</h3>
${createCircularGraph(data, {width: width, height: 500})}
</div>
</div>
### 生データ (JSON)
```js
display(data);
```
画面
以下のページが作成できた
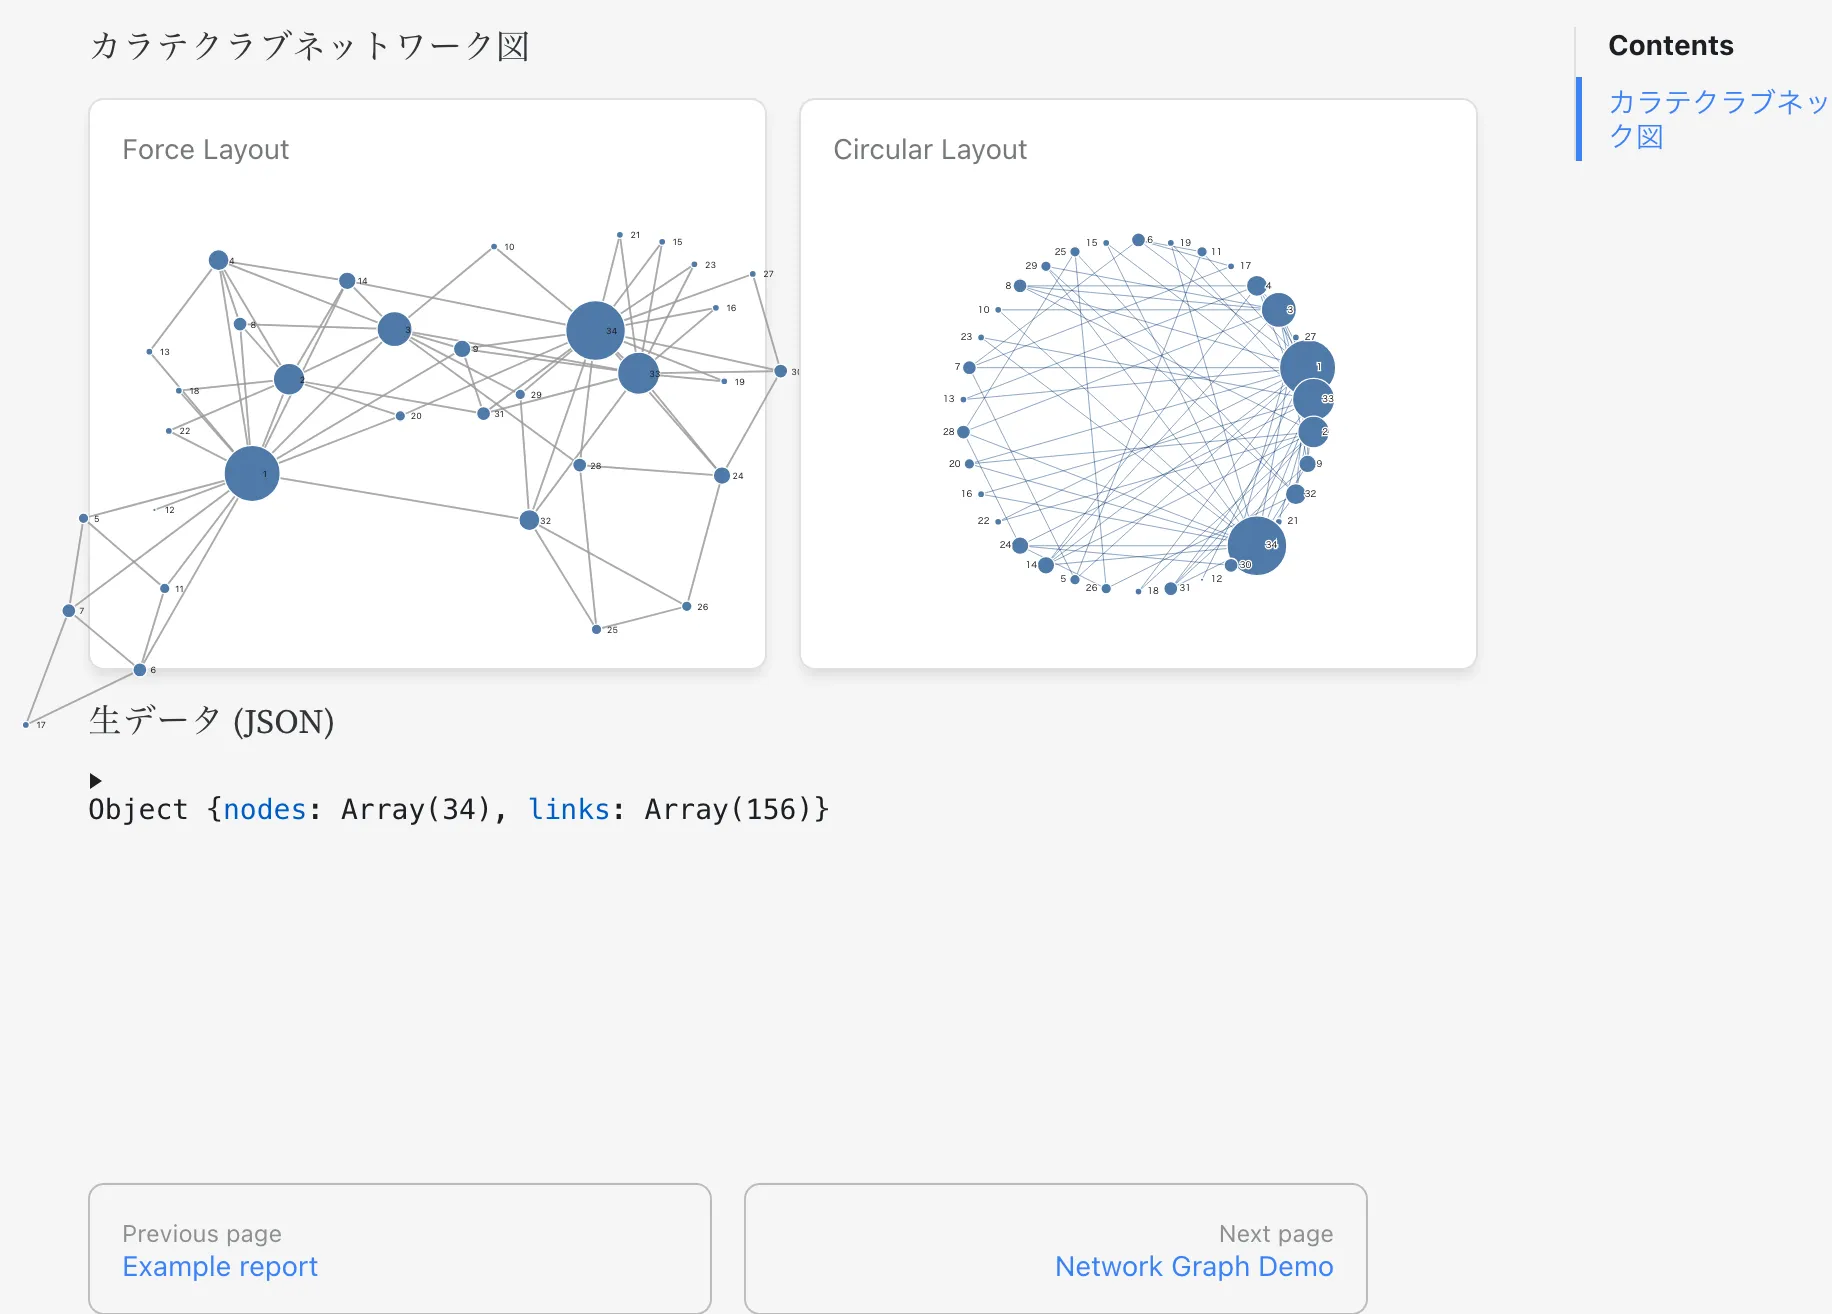
また、ノードをドラッグしてウネウネ動かすことができ、大満足

deploy
公式ドキュメントに載っていたのでgithub pagesにした
https://observablehq.com/framework/deploying
はじめに、リポジトリ設定からgithub actions経由でgithub pagesへのデプロイを有効化する。リポジトリの画面からsettingsタブ→サイドバーのPages→Build and deploymentセクションの→Source項目→ドロップダウンからGithub Actionsとして
github actions経由でのgithub pagesのデプロイを有効にしておく(あるいはgithub actions pages enable で検索したらAIが教えてくれる)
ドキュメントと実装したworkflowファイルの差分はこのあたり。buildステップ実行前にdata loader用uvコマンドを追加でインストールしている
+ # data loader
+ - uses: astral-sh/setup-uv@v7
+ with:
+ version: "latest"
一応全部のせておく
name: Deploy to github pages
on:
push: {branches: [main]}
#schedule:
#- cron: "0 0 * * *" # run on 0:00 jst
workflow_dispatch: {}
jobs:
deploy:
runs-on: ubuntu-latest
permissions:
contents: read
pages: write
id-token: write
environment:
name: github-pages
url: ${{ steps.deployment.outputs.page_url }}
steps:
- uses: actions/checkout@v4
# data loader
- uses: astral-sh/setup-uv@v7
with:
version: "latest"
- uses: actions/setup-node@v6
with:
node-version: 22
cache: npm
- run: npm ci
- run: npm run build
- uses: actions/configure-pages@v4
- name: upload pages artifact
uses: actions/upload-pages-artifact@v3
with:
path: dist
- name: Deploy
id: deployment
uses: actions/deploy-pages@v4
setup observable config
uv scriptsを実行する際、必要だった設定。デプロイ時に必要となる。interpretersに.pyファイルの実行コマンドを設定する
プロジェクトを生成したときに observablehq.config.js は作成されているはず。interpretersオブジェクトを追加した
export default {
...
interpreters: {
".py": ["uv", "run"],
},
};おわりに
evidence bi使ってるし、observable frameworkも触ってみないとだよなと思ったので試した。
プロットの表現力や柔軟性はさすが。また、sql以外でデータを取得する(dwhやストレージなどに持ちたくない)場合はobservable framework一択になりそう
同じようなコンセプトのソフトウェアではあるが、どちらも強みの異なる部分があり、棲み分けられており、すごい